Through FEDECOM Voices, we invite project partners to share the ideas, experiences and innovations that are helping shape the future of energy communities. In this edition, we feature R2M Spain and its work on transforming complex energy data into clear and actionable information for users and managers across FEDECOM’s pilot sites.
As energy systems become increasingly interconnected and digitalised, they generate growing volumes of information from different technologies, services and users. But access to data alone is not enough. For energy communities to make effective use of this information, data needs to be organised, contextualised and presented in ways that support understanding and informed decision-making.
Within FEDECOM, R2M Spain is helping address this challenge by leading Task 5.4 on role-specific visualisation and operation monitoring tools.
The team is developing a comprehensive visualisation platform that brings together standardised data from across the project and transforms it into dashboards tailored to different levels of users: final users, site managers and pilot managers. Each profile has access to information relevant to its role, providing progressively broader levels of visibility and control over pilot activities and energy assets.
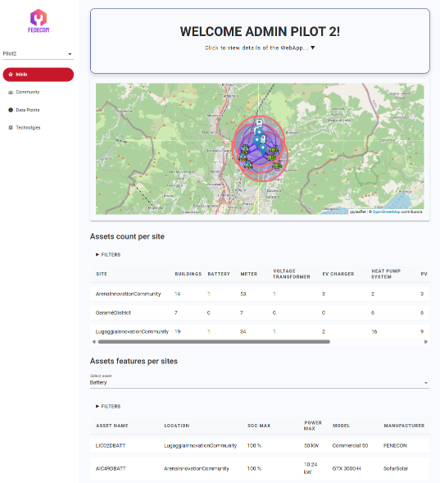
R2M Spain visualisation platform: pilot overview, including pilot location, assets per site and available technologies
The platform integrates information from technologies including HVAC systems, photovoltaic generation and energy storage, alongside pilot and project Key Performance Indicators (KPIs), performance indicators and other relevant datasets. By filtering, aggregating and contextualising this information, the tool helps users better understand how technologies are performing and how they influence energy generation and consumption patterns.
A major step has already been achieved. The core structure of the application has been developed, the different user roles have been defined and the main time series have been connected to the corresponding visualisation dashboards. A methodology for creating aggregated series from relevant datasets has also been implemented within the project database.
Developing a common visualisation environment across FEDECOM’s pilots has nevertheless required more than simply connecting datasets. The pilots operate in different national contexts and rely on different data sources, technologies and organisational structures. While the overall standardisation of FEDECOM data has facilitated the development of a common framework, R2M Spain has also had to introduce pilot-specific adjustments to ensure that the tool responds to these different realities.
These adjustments are now largely completed. As the final data sources are integrated into the FEDECOM database, the team is completing the last developments required for the platform’s internal deployment.
The visualisation platform is also progressively connecting with other tools and energy services developed across FEDECOM. As these services become available, their outputs can be combined with the data they represent or influence. For example, users can compare actual energy generation with predictions for the following 48 hours, helping transform forecasting results into information that can directly support operational decisions.
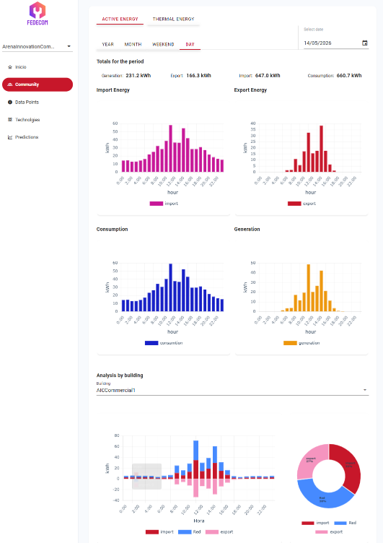
R2M Spain visualisation platform: energy dashboard displaying energy flows, including import, export, consumption and generation data, together with building-level analysis
This integration is particularly important to FEDECOM’s broader approach. Rather than presenting different datasets and services in isolation, the visualisation platform acts as a central hub where information from across the project can be brought together and presented according to the needs of each user.
In this way, complex technical information becomes more accessible and meaningful, helping pilot managers, site managers and final users understand what is happening within their energy system and make better-informed decisions.
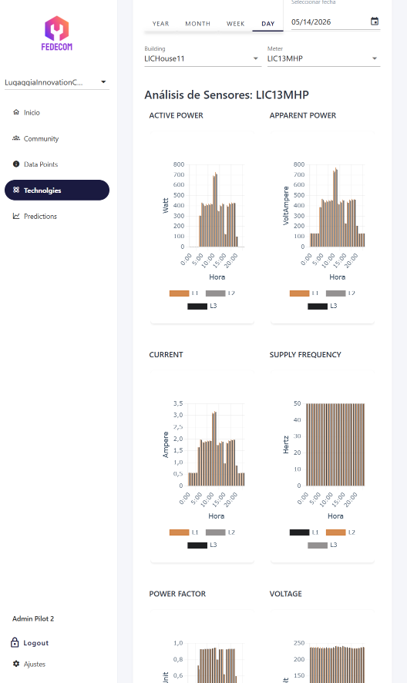
R2M Spain visualisation platform: detailed technology and sensor monitoring, including active and apparent power, current, supply frequency, power factor and voltage
For R2M Spain, this is ultimately where the value of data lies: not simply in collecting increasing amounts of information, but in transforming that information into knowledge that people can understand and use.
“Effective energy management starts with making complex information understandable. Through FEDECOM’s visualisation platform, we aim to transform vast amounts of generation, consumption and performance data into clear, relevant and actionable insights at all management levels, from final user to pilot manager, incorporating relevant KPIs and showing the most important elements depending on the user profile. At the moment, we are gathering the final data sources from each pilot, and the tool will soon be ready for deployment.”
Lucas Porto, Energy Services Coordinator, R2M Spain
Through the combined efforts of all partners, FEDECOM continues to demonstrate how interoperable, flexible and federated energy communities can accelerate Europe’s energy transition.